
When most people hear “GIS,” their first thought is probably maps. And while maps are certainly part of the job, the work of Palmer Engineering’s GIS team goes far beyond putting lines and points on a screen.
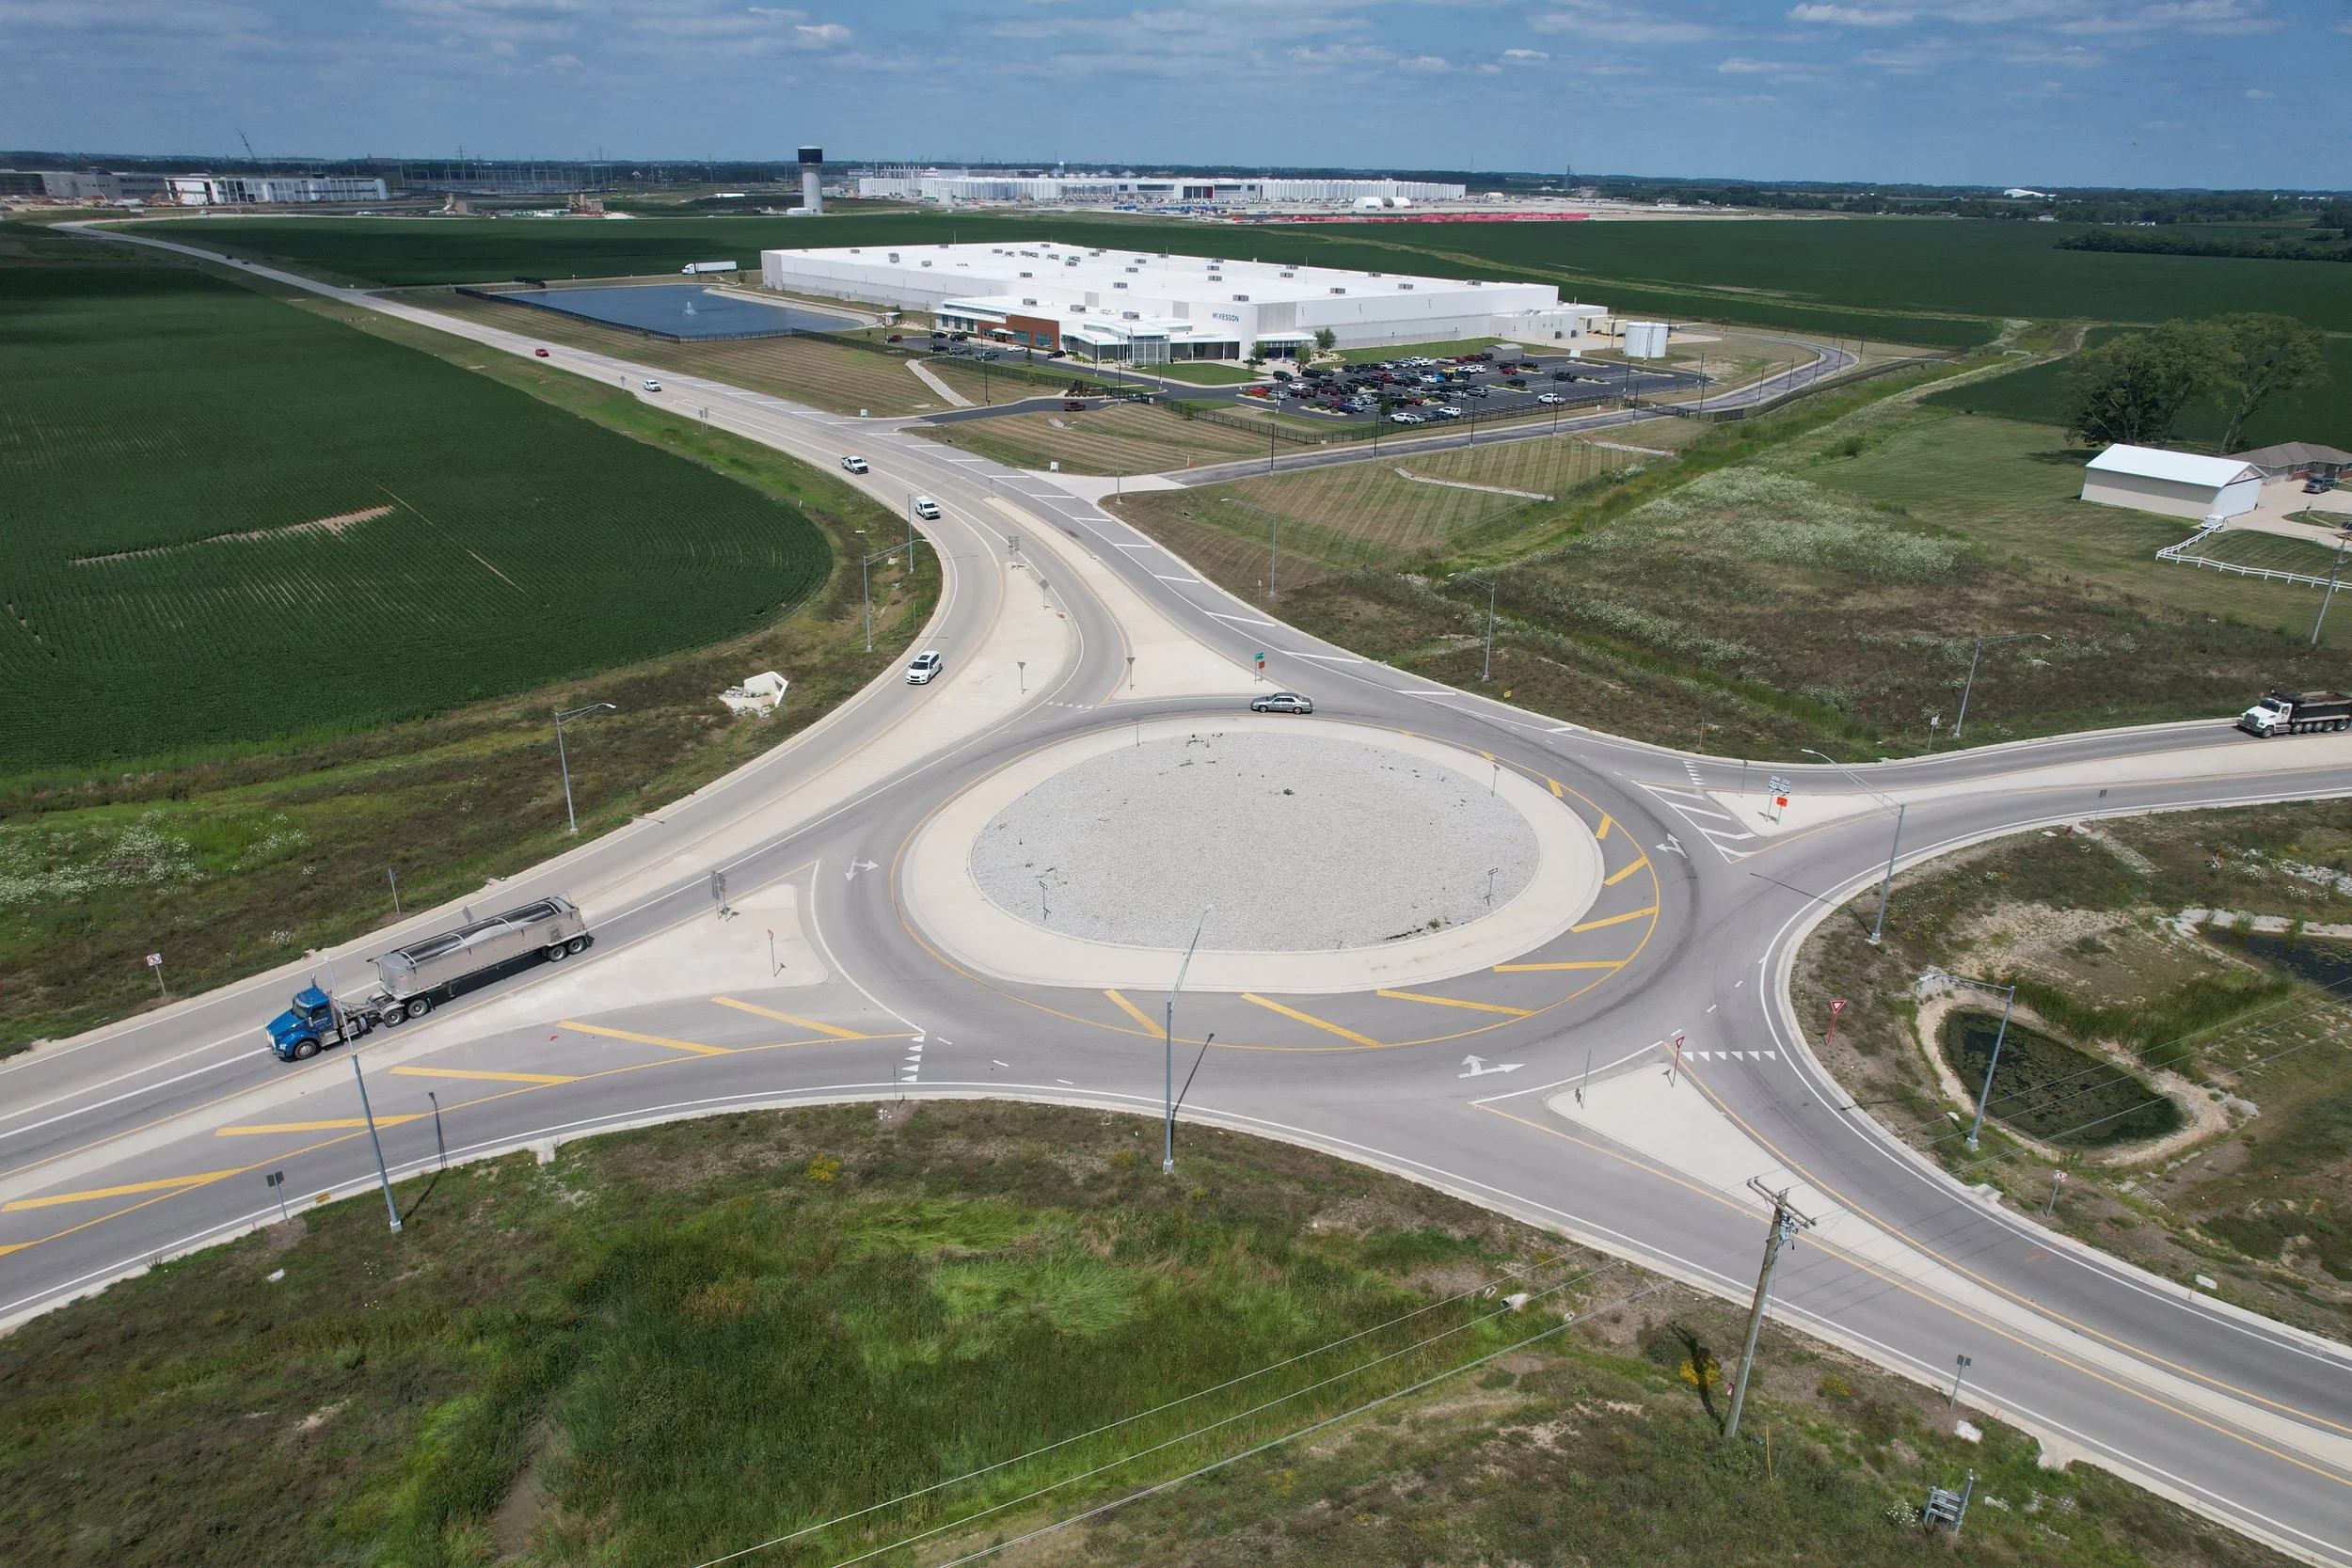
Returning for a New View: Palmer GIS team member Hunter Evans captured this drone photo of a roundabout in Fayette County, Ohio, designed by Palmer Engineering. Hunter returned this summer to capture updated aerial photos of the completed project.
GIS — Geographic Information Systems — helps our team analyze and visualize information to uncover patterns, better understand project conditions and support informed engineering decisions.
For GIS team member James Thompson, that connection between information and location is at the heart of the work.
“GIS is about data and place,” James said. “Everything on Earth has some information at any given location, and GIS helps answer why a particular event happened, what relationships to an event are available in any given area, and can aid in visualizing that information in a fun and pleasing way.”
Hunter Evans describes GIS from another perspective: how that information ultimately becomes useful to the people making decisions.
“GIS helps us better understand the world around us using various mapping tools,” Hunter said. “Our GIS team uses multiple systems to present data that can be viewed on maps, which go into reports, to then help engineers and clients make real-world decisions.”
Together, those ideas capture much of what GIS brings to engineering: taking information tied to a location, finding meaning in it and communicating that meaning in a way that people can use.
From Highway Safety to Environmental Resources
Because so much engineering data has a geographic component, Palmer’s GIS team supports a wide range of projects. James works frequently on Highway Safety Improvement Program (HSIP) projects, where GIS helps the team better understand highway safety within a particular area. That often involves visualizing crash data and examining the spatial characteristics that could help explain why crashes are occurring in certain locations.
Hunter’s work frequently focuses on environmental resources and identifying streams, wetlands and forests that could be affected by future development.
For those projects, the GIS team’s work isn't limited to sitting behind a computer. Team members may head into the field to collect and digitize information before bringing that data back to the office, reviewing and refining it for accuracy, and ultimately developing maps for project reports.
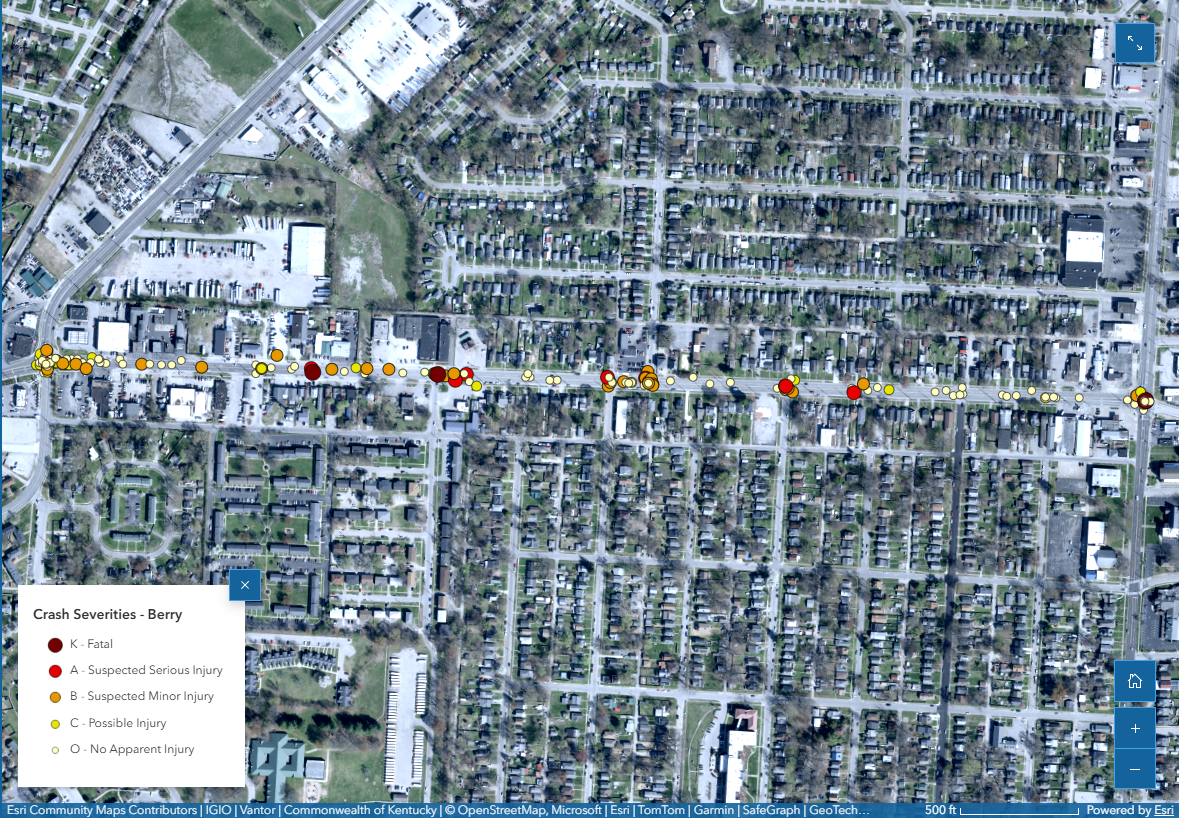
Crash Data Along Berry Boulevard in Louisville, KY
This GIS map analyzes five years of crash data from 2018–2022 along Berry Boulevard in Louisville, providing a visual look at crash locations and patterns along the corridor.
Different projects. Different data. But the goal is similar: understand what is happening in a particular place and turn that information into something the project team can use. And the accuracy of that information matters.
James points to environmental and traffic noise studies as examples of how reliable data can directly influence a project. If streams or wetlands will be affected by construction, accurately identifying those resources can help determine potential mitigation requirements and associated costs.
The same principle applies to traffic noise assessments. Accurate traffic and noise data can help determine whether a neighborhood or community may qualify for noise abatement. In both cases, the information behind the map can have a very real impact on a project and the people who live around it.
Finding Solutions in the Data
Sometimes, the information the GIS team receives doesn't arrive in a neat, ready-to-map package. One of James' more memorable challenges involved thousands of events that didn't include traditional latitude and longitude coordinates. Instead, he had only the county, roadway and mile point for each event. James developed a way to automate the process of turning those pieces of information into actual locations on a map — and achieved a surprisingly high success rate.
Hunter encountered a different challenge while developing maps for the Wolf Run Watershed. The project required working across several software applications and trying different approaches to effectively display sample data and locations for the client.
Challenges like these are also part of what makes GIS work interesting: every dataset presents a new opportunity to solve a problem.
A Different View from Above
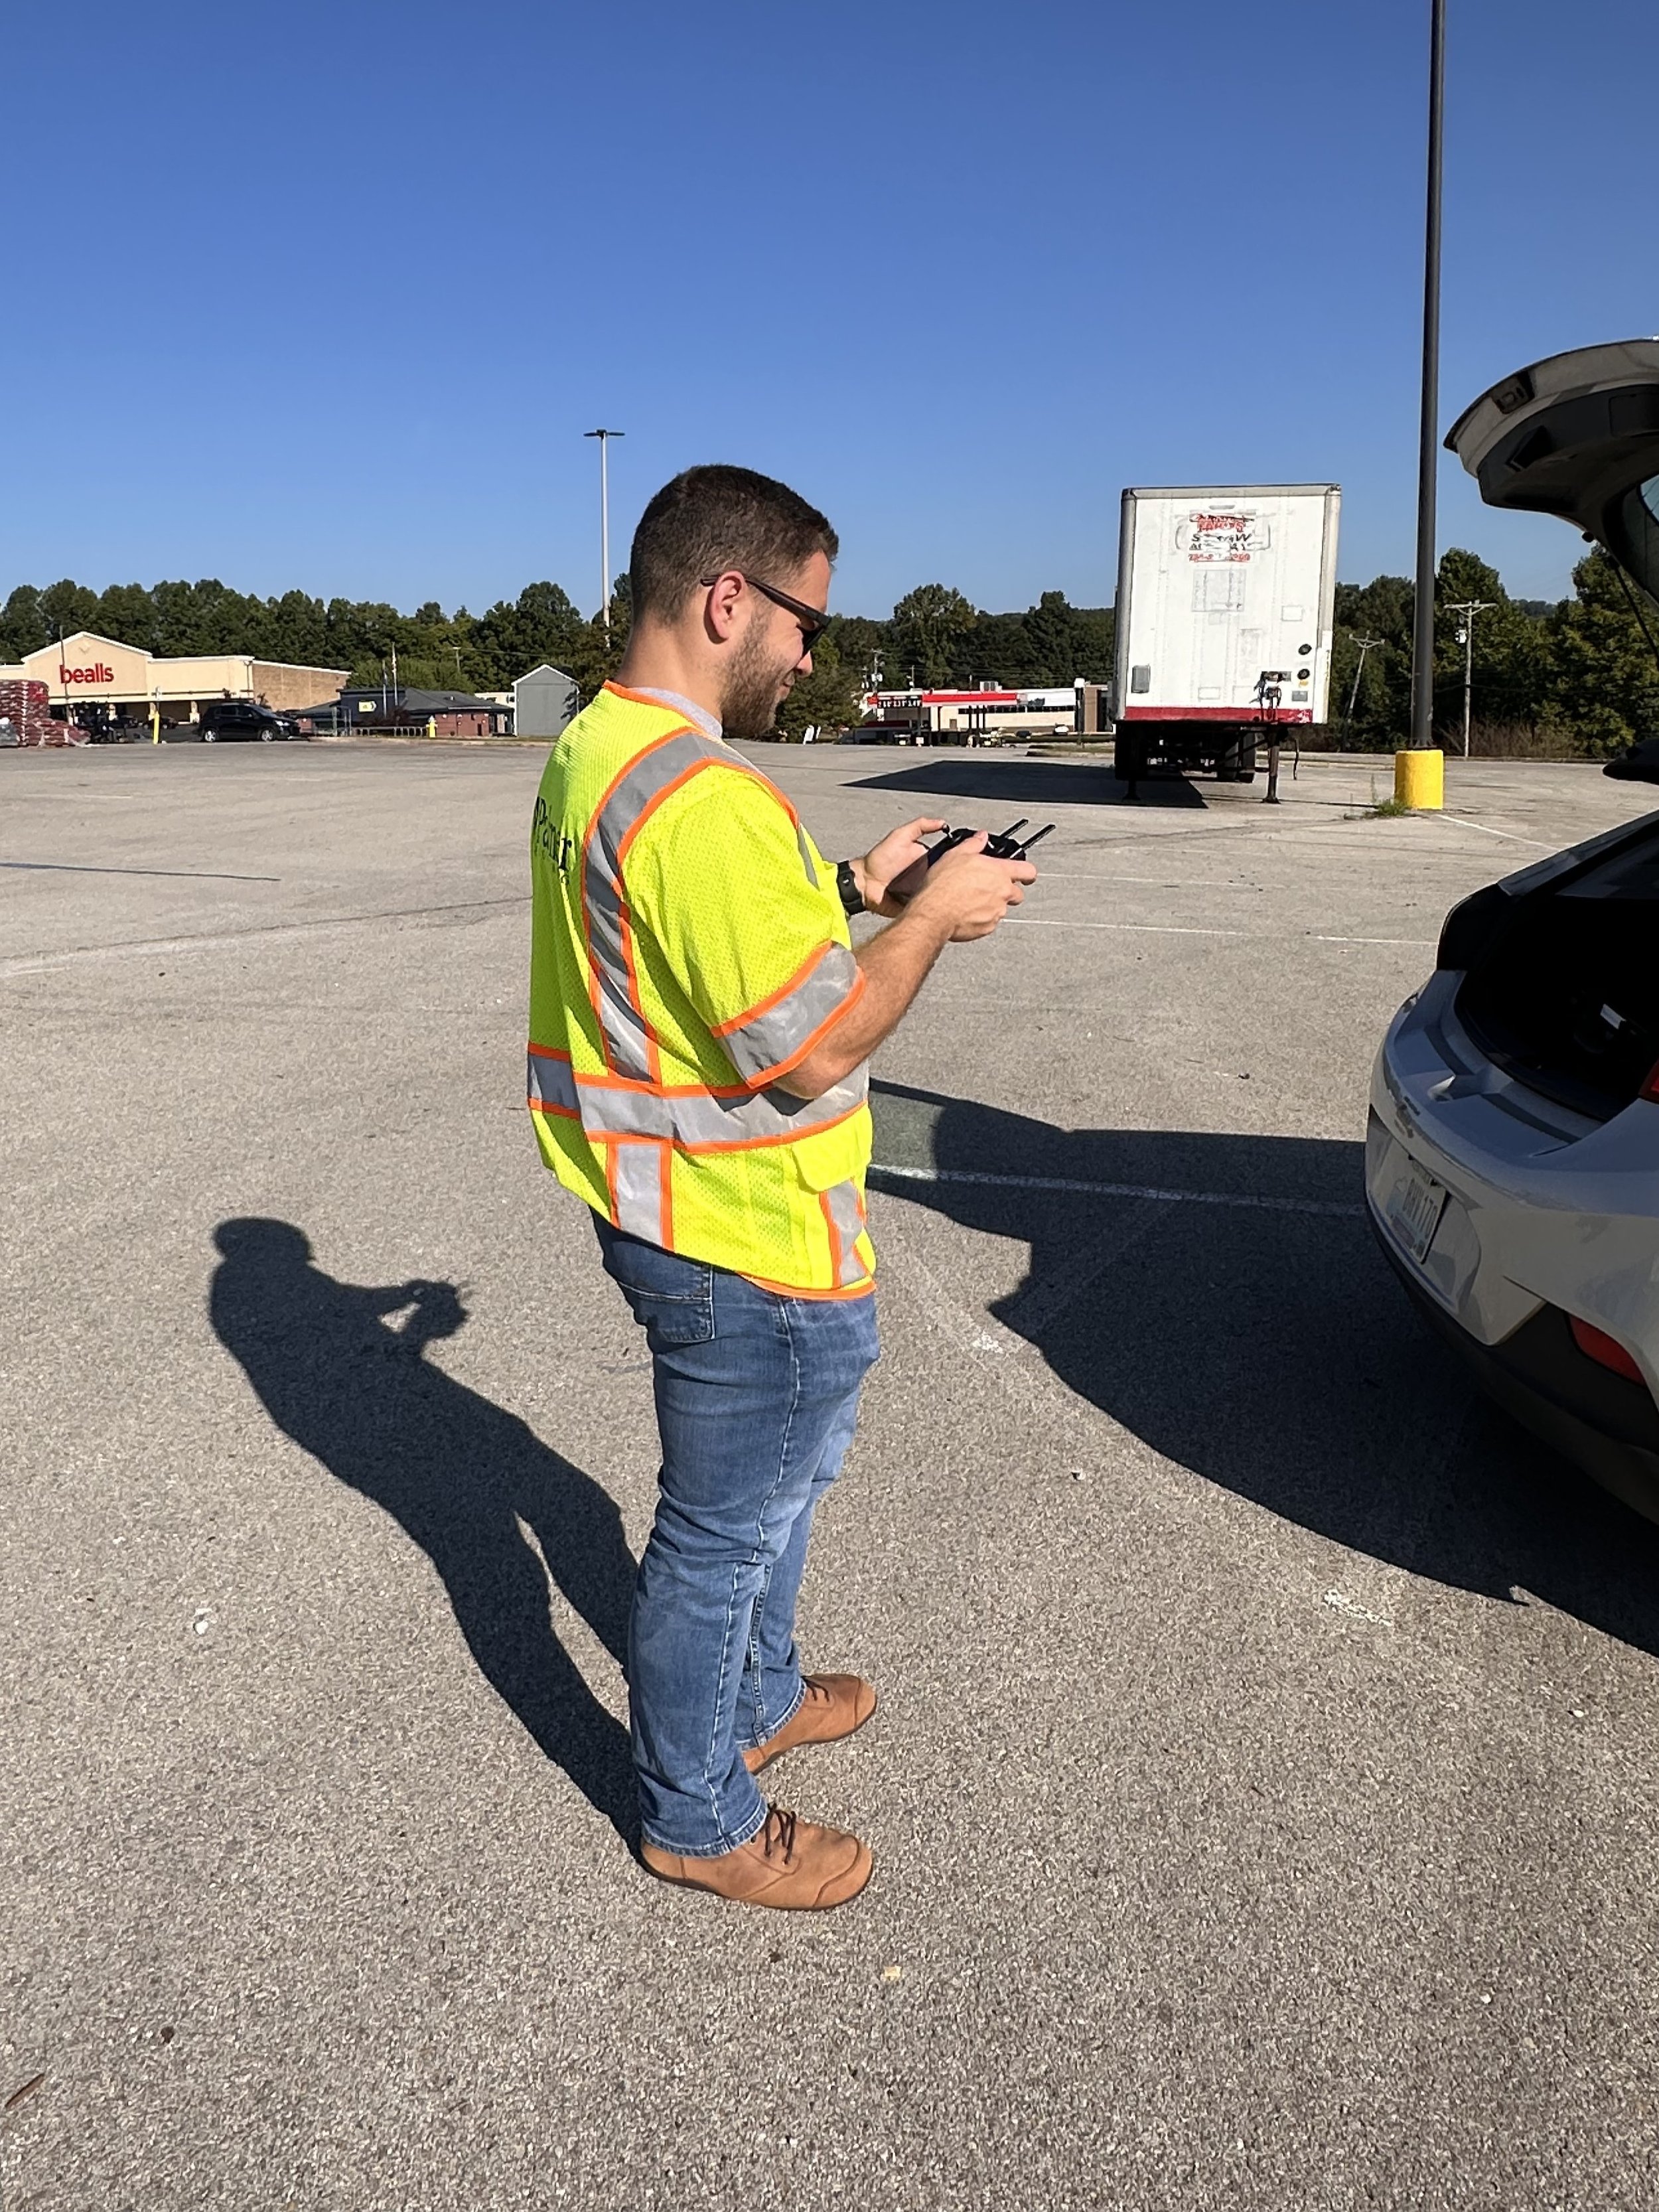
Drone Technology at Work: James Thompson pilots a drone to capture aerial imagery, providing the team with a broader view of the site and surrounding area.
Sometimes the data the team needs is best captured from the sky. Drones have expanded what GIS teams can collect and visualize, from aerial photography to photogrammetry and LiDAR. Images captured over a large area can be stitched together to create recent orthographic imagery, while other drone-based data can be used to develop realistic models of existing conditions that support the design process.
At Palmer, the applications have included planning industrial parking lot expansions, tracking parkway construction progress and assisting with bridge inspections.
Drone photography also gives Palmer a valuable way to document our projects throughout their lifecycle. From capturing construction progress to showcasing a completed project, aerial photography provides a perspective that can reveal the scale, surroundings and details of our work in ways that aren't always possible from the ground.
For James, photographing the Mountain Parkway Expansion in July 2023 remains one of his favorite drone assignments.
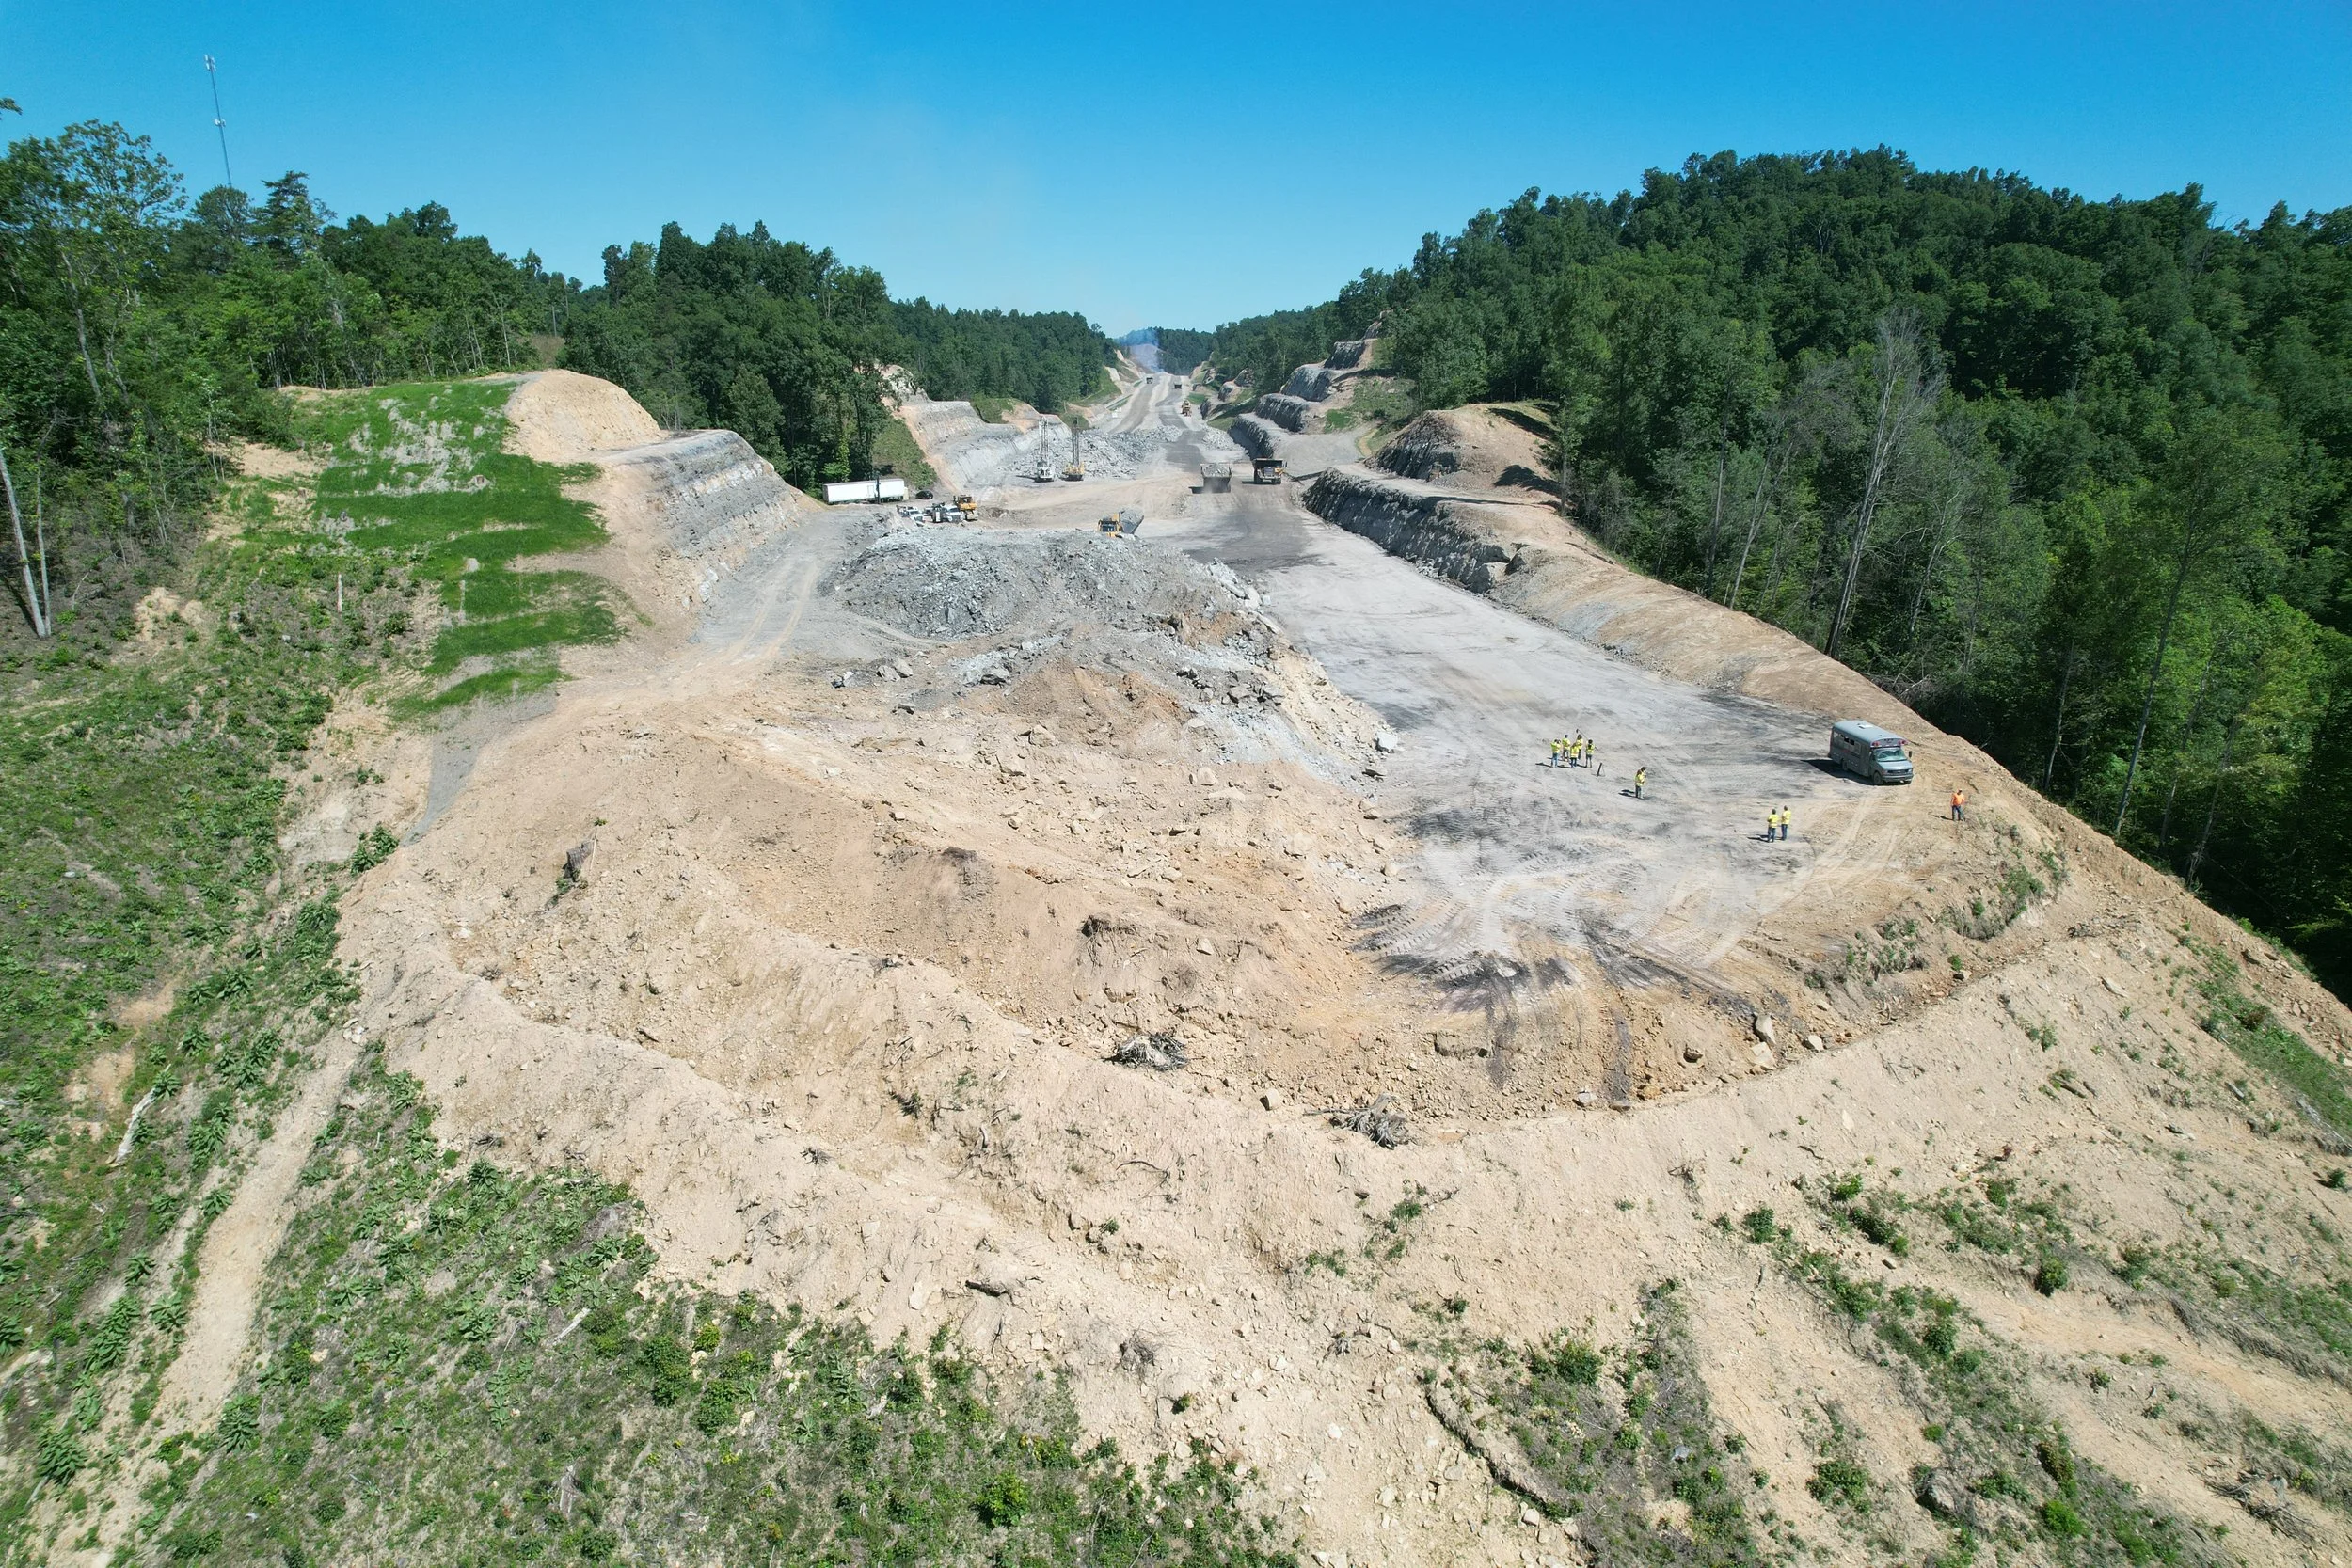
Mountain Parkway from Above: Captured by James Thompson in June 2026, this aerial view of the Magoffin-Floyd segment of the Mountain Parkway highlights the scale of construction and provides a unique look at the project’s progress through Eastern Kentucky.
“You truly could sense the scale of the operations from the drone while being on site,” he said.
James returned to the Mountain Parkway in June 2026, capturing new drone footage of construction underway along the Magoffin-Floyd segment and providing an updated aerial perspective as the project continues to take shape.
But successful drone photography isn't simply a matter of sending a drone into the air and pressing a button. James considers the surrounding landscape, time of day, angle of the sun and other elements that can turn a straightforward project photo into a more compelling image.
“There is a lot of room for creativity beyond just capturing a roadway,” he said, “and that makes every trip a lot of fun.”
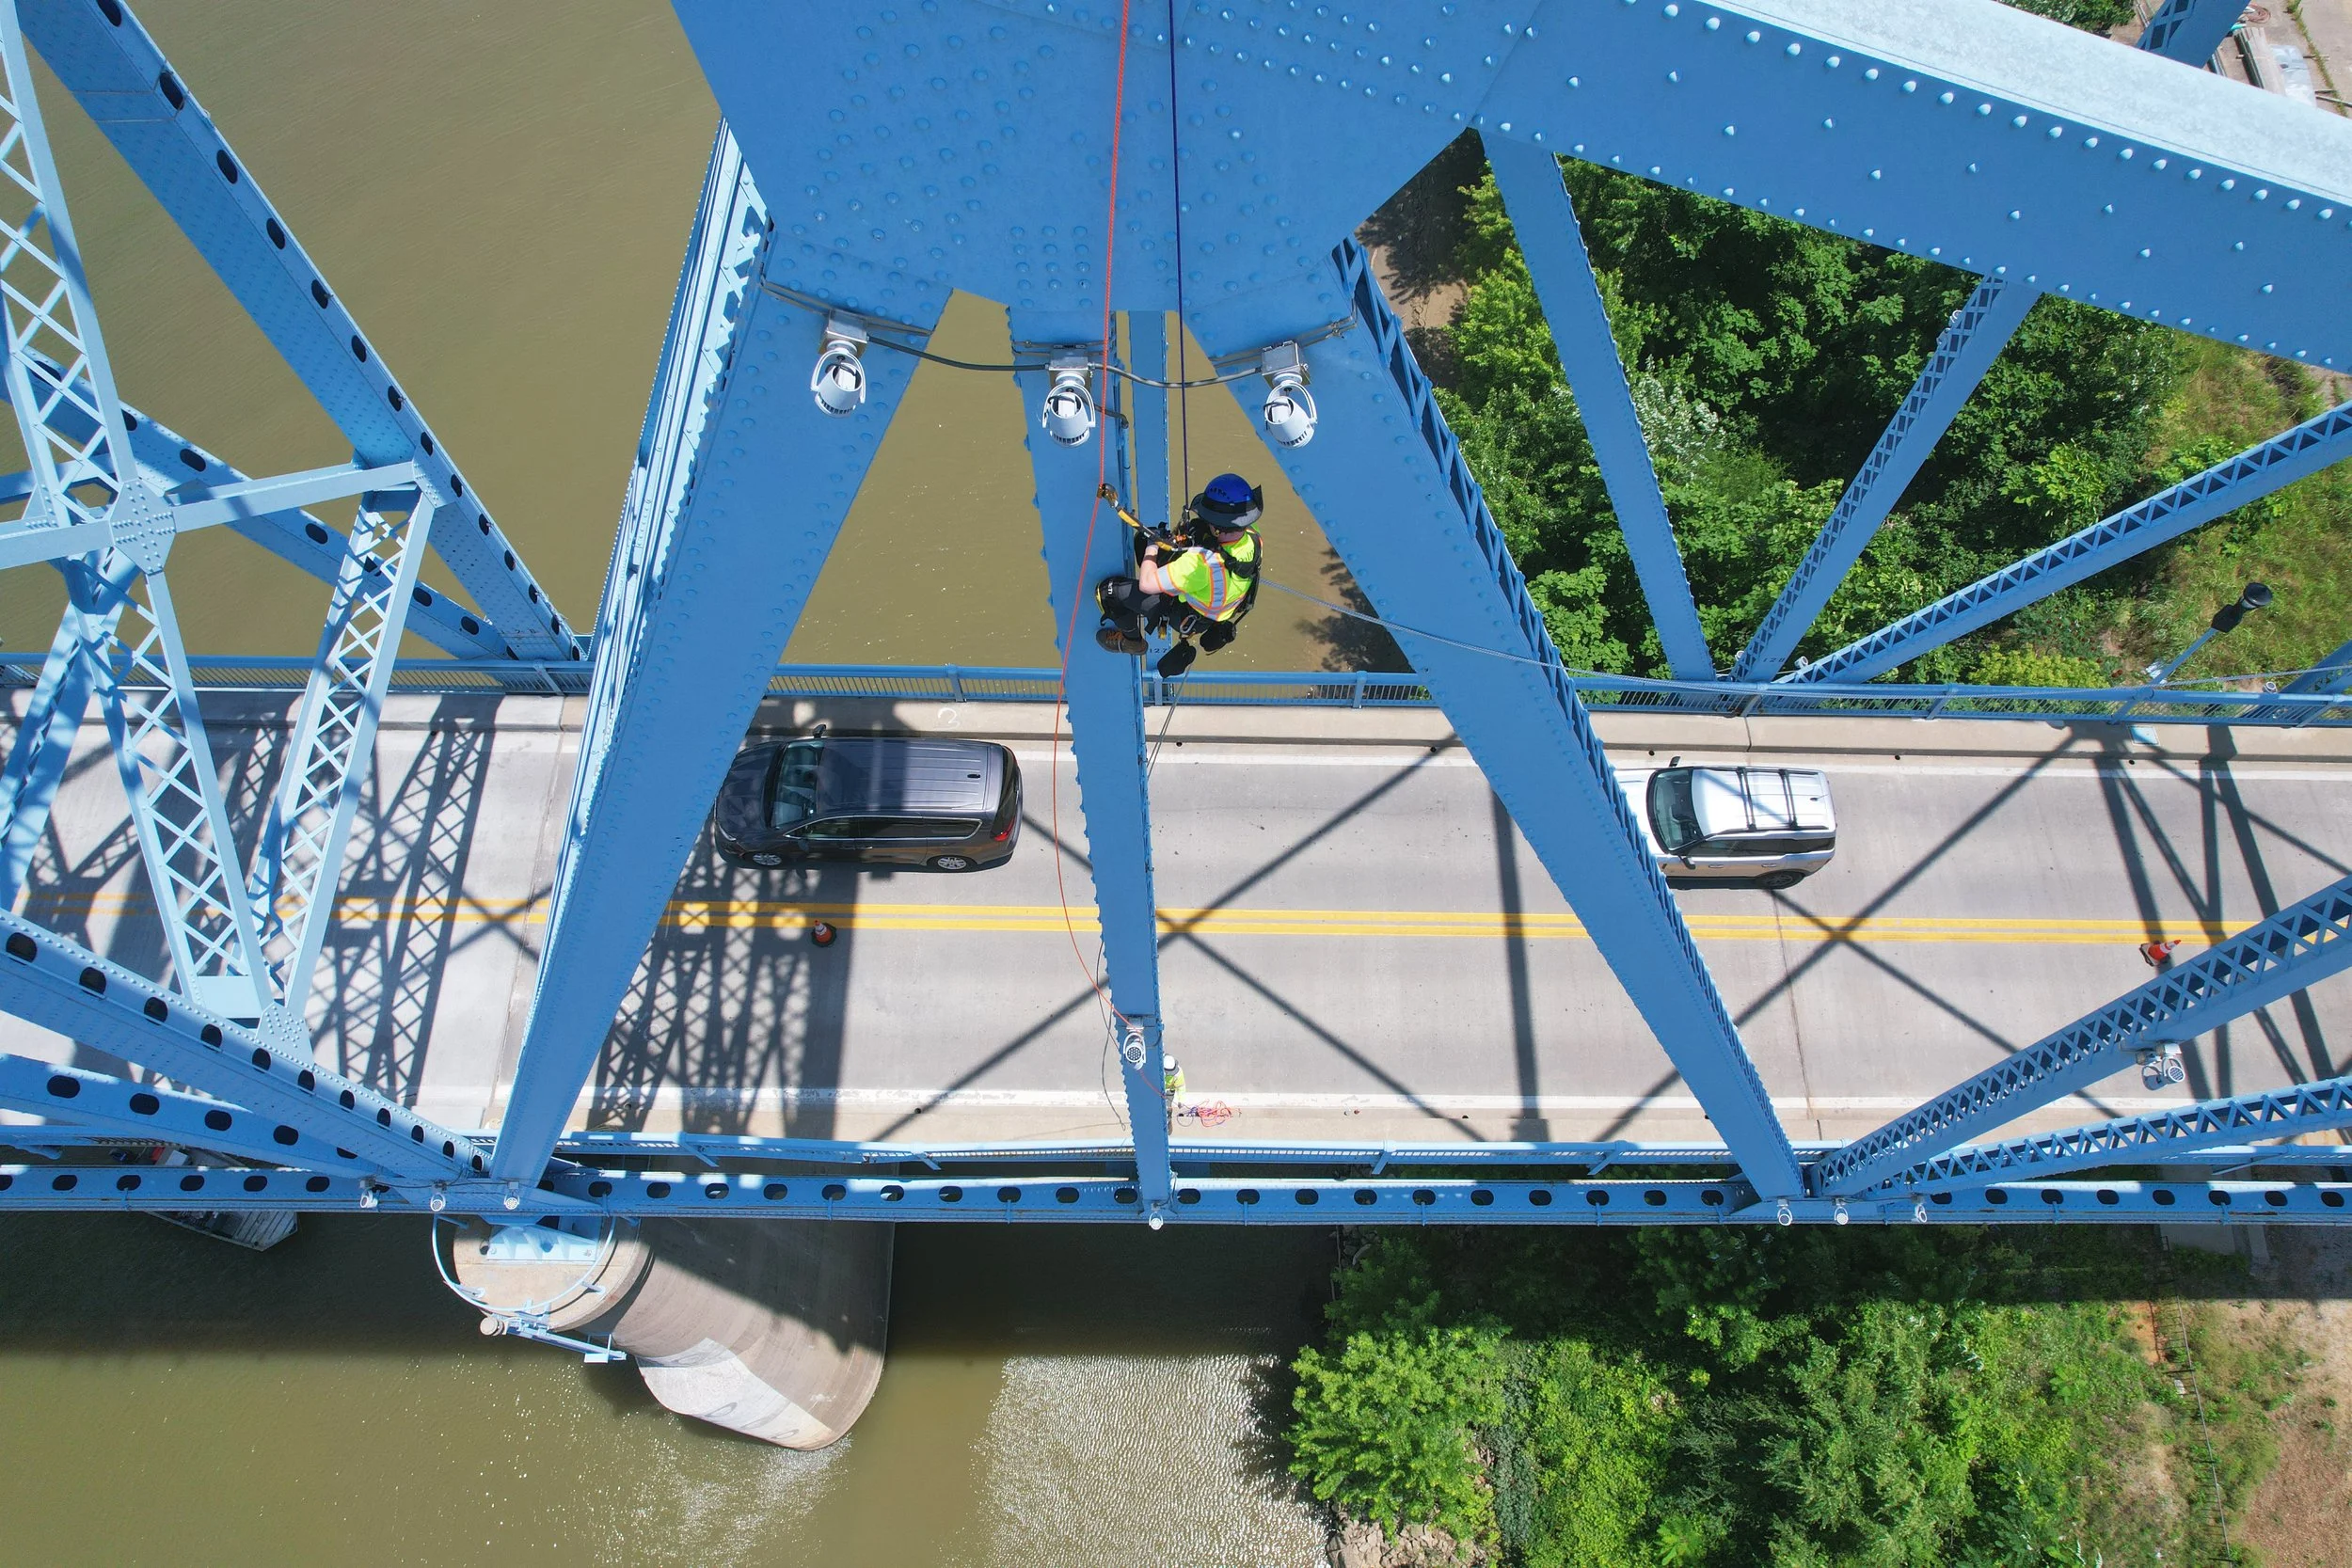
A View Only a Drone Can Capture
James Thompson captured this aerial image during a recent bridge inspection of the Glover Cary Bridge in Owensboro, Kentucky. Perspectives like this would be difficult—if not nearly impossible—to capture without drone technology, giving project teams a unique view of the bridge and details that can’t easily be seen from the ground.
Where Data Meets Creativity
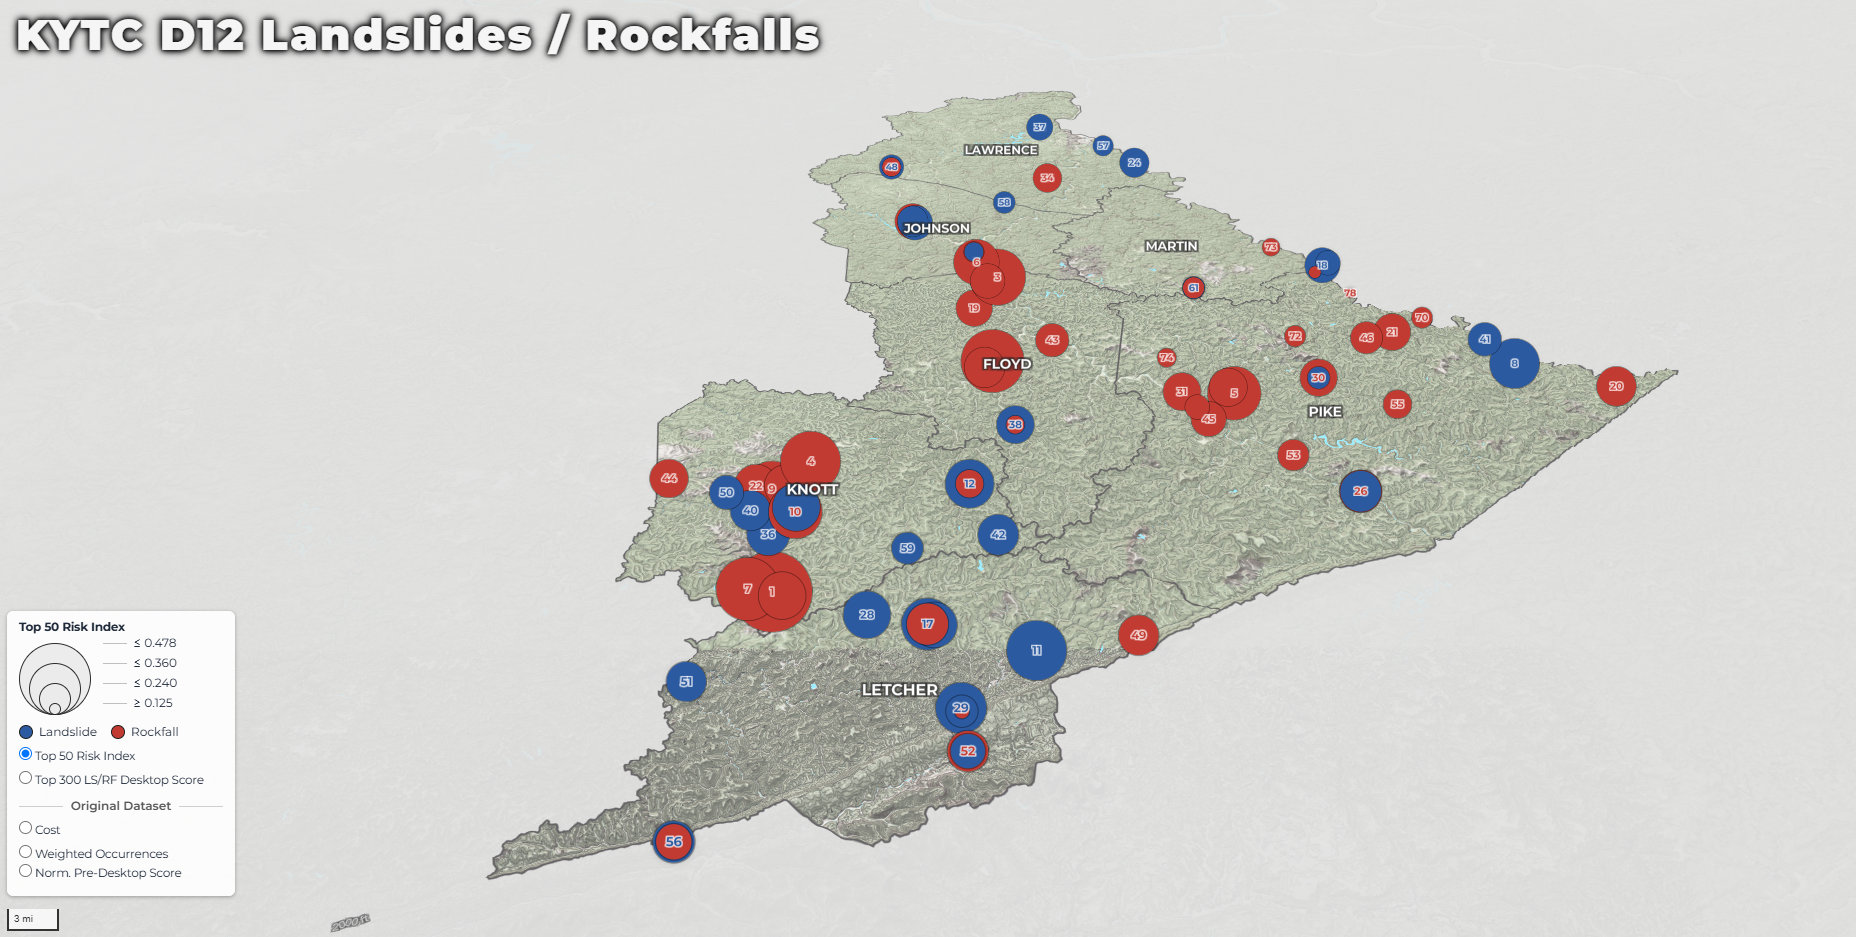
That idea of creativity comes up frequently when James and Hunter talk about their work. James primarily works in ArcGIS Pro, using it both to analyze information and turn that information into a clear, visually engaging product. As his GIS experience has grown, so has his interest in finding subtle ways to make maps more effective. A reader may only look at a map for a few seconds before moving on, and James wants those few seconds to count. His goal is to make the information immediately understandable while also creating something visually interesting enough to hold the reader's attention.
One example is an interactive map James developed for the Kentucky Transportation Cabinet’s District 10 and District 12 offices showing landslides and rockfalls. The map brings project data to life, allowing users to explore information geographically rather than simply viewing it in a static format.
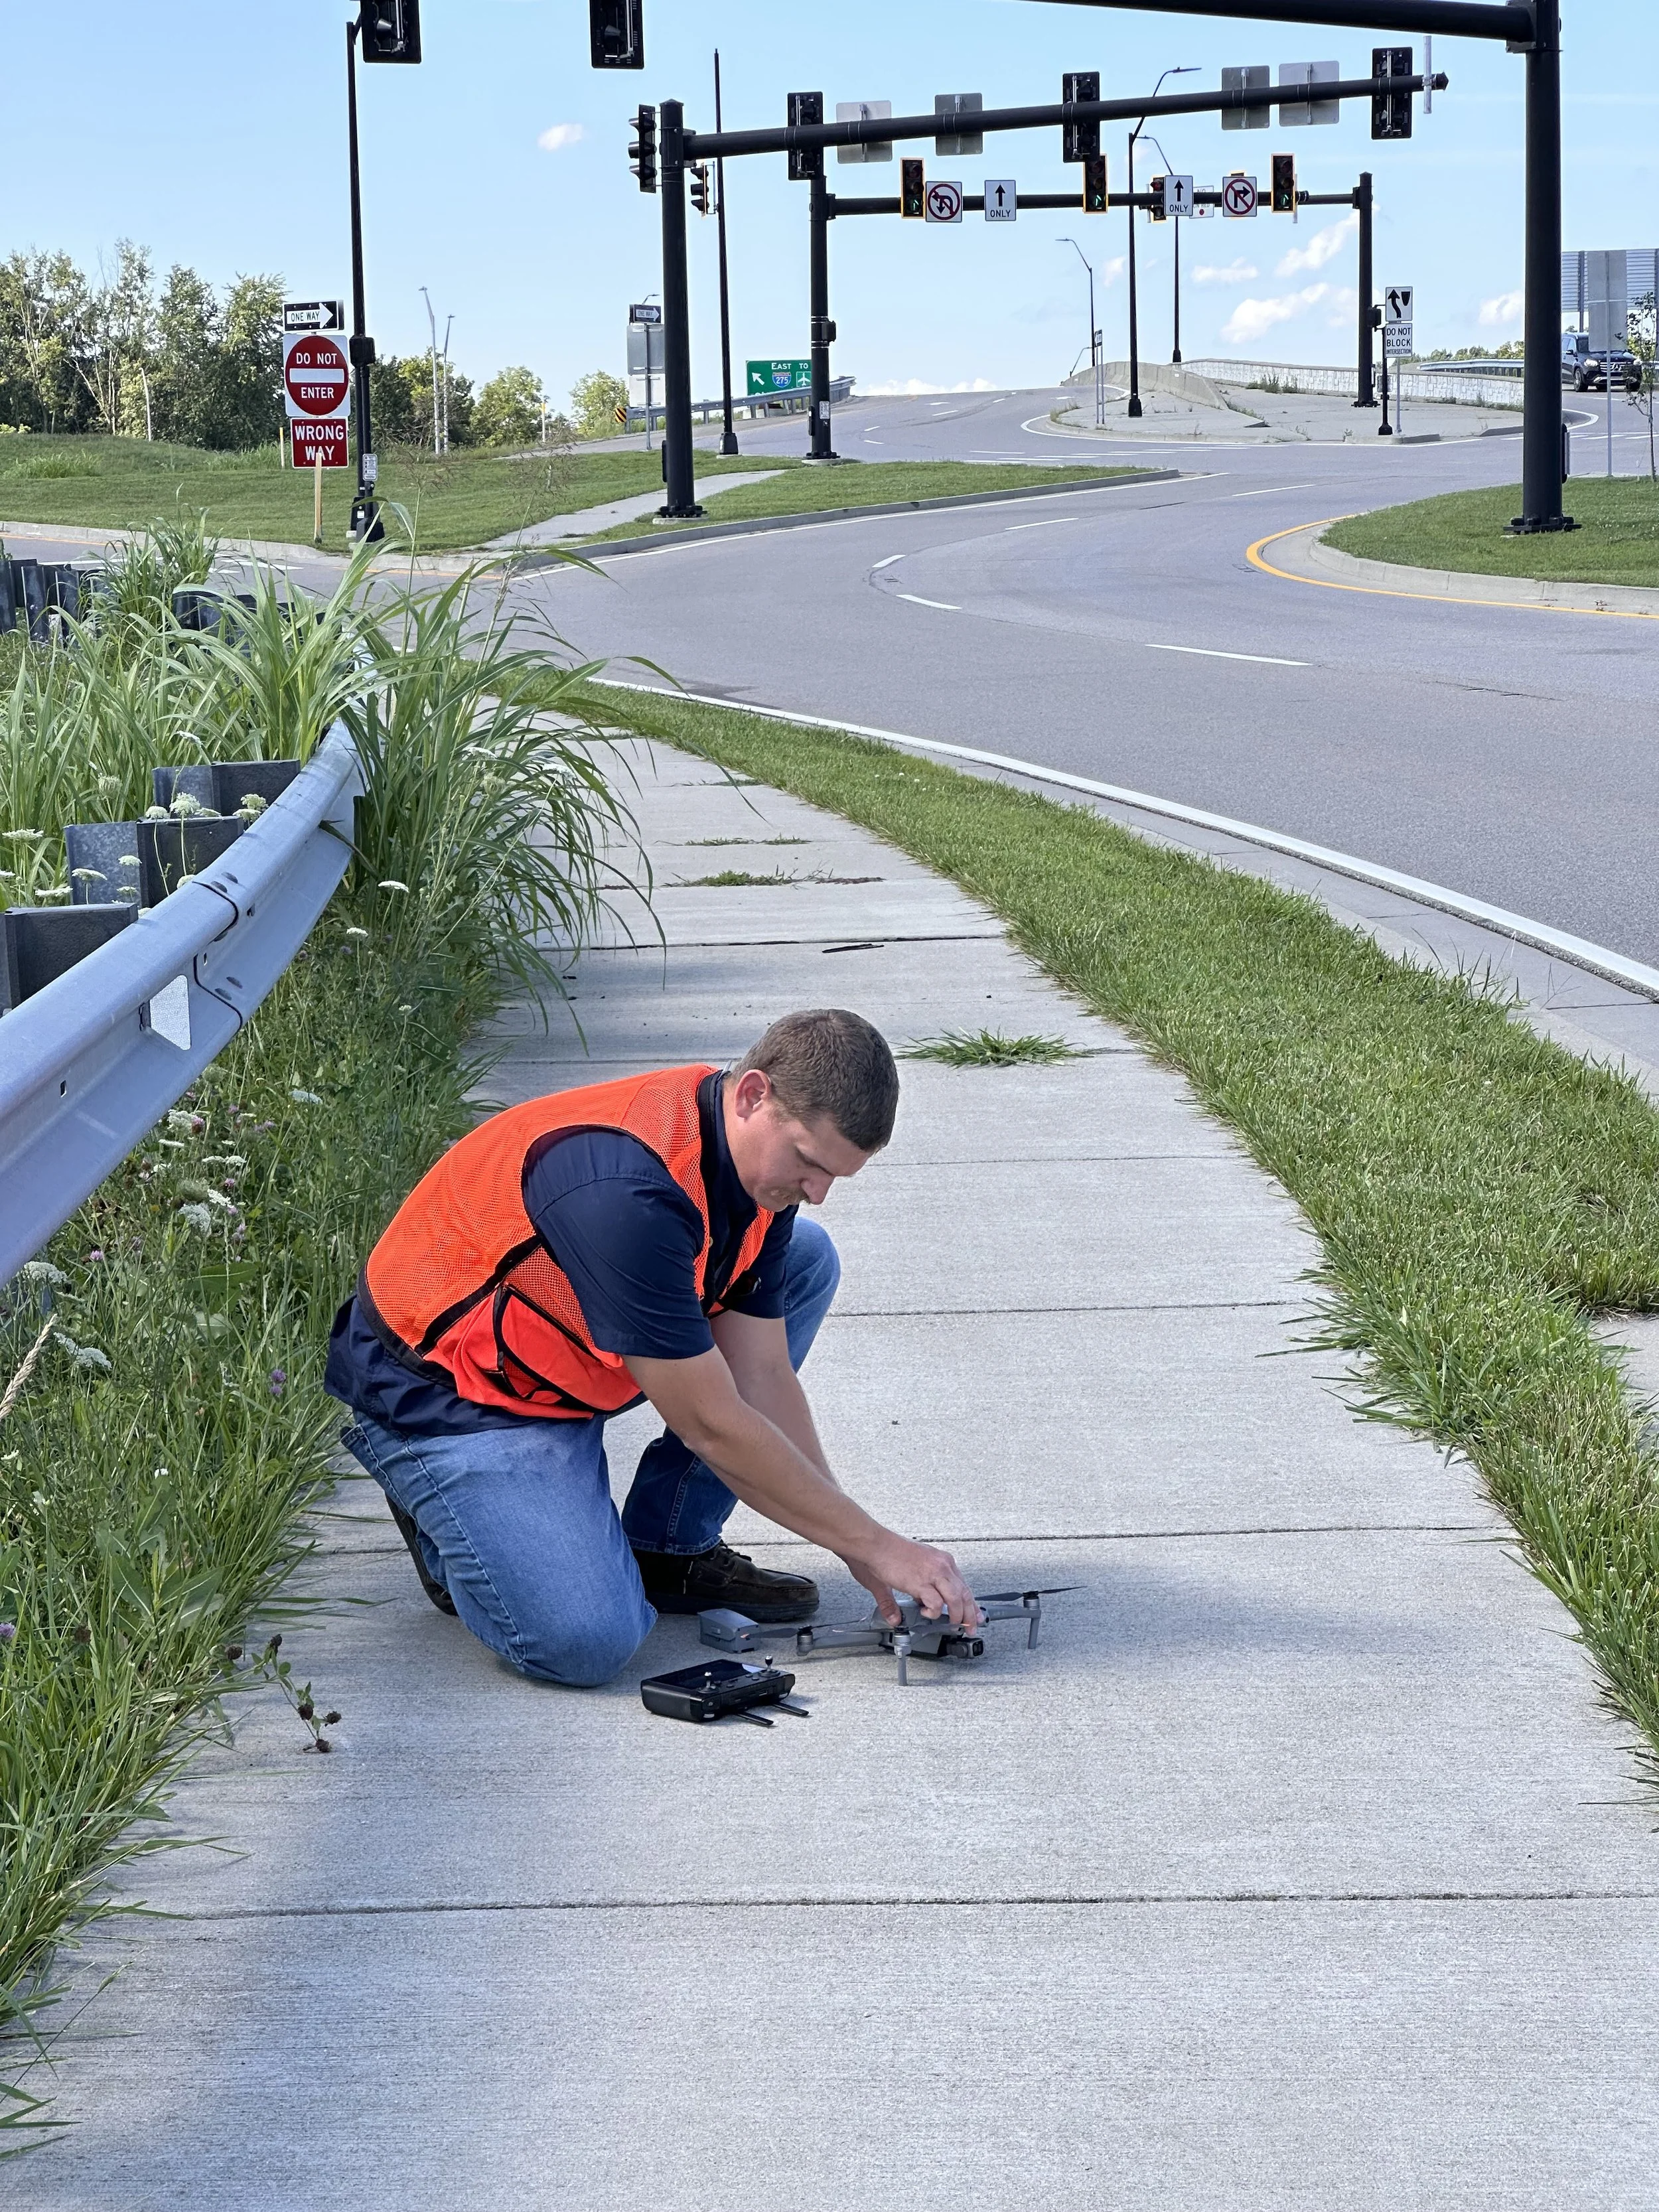
Documenting a Completed Project: Hunter Evans prepares to fly the drone at Graves Road in Boone County, Kentucky, to capture updated aerial photos and video of the completed project.
Hunter sees that same creative opportunity in his work.
“My favorite part of working on the GIS team is that it gives me a creative outlet previous jobs could not offer,” he said. “I see value in our work, and I'm challenged daily. I even find myself thinking of ways to improve map quality or data acquisition even in my free time.”
James' appreciation for the creative side of GIS can be traced back to a lifelong fascination with maps.
“I have always loved maps,” he said. As a child, he remembers looking at topographic maps and understanding how their shapes and lines represented the terrain and landscape. His lifelong interest in geology eventually led him to GIS and an understanding of how the technology could connect with the subjects that already fascinated him.
That same curiosity continues to shape how he approaches his work today.
“GIS is more than just making maps,” James said. “There is so much that can be done with GIS, I am still learning new things all the time.”

View From Above: Captured by Hunter Evans, this aerial view of Graves Road in Boone County, Kentucky, showcases how drone photography can provide a unique perspective of Palmer’s finished projects.
And that's part of what makes GIS such a valuable tool for engineering. It brings together information from the field, sophisticated technology, problem-solving and visual communication — helping turn complex data about the world around us into information our engineers and clients can use to make better decisions.
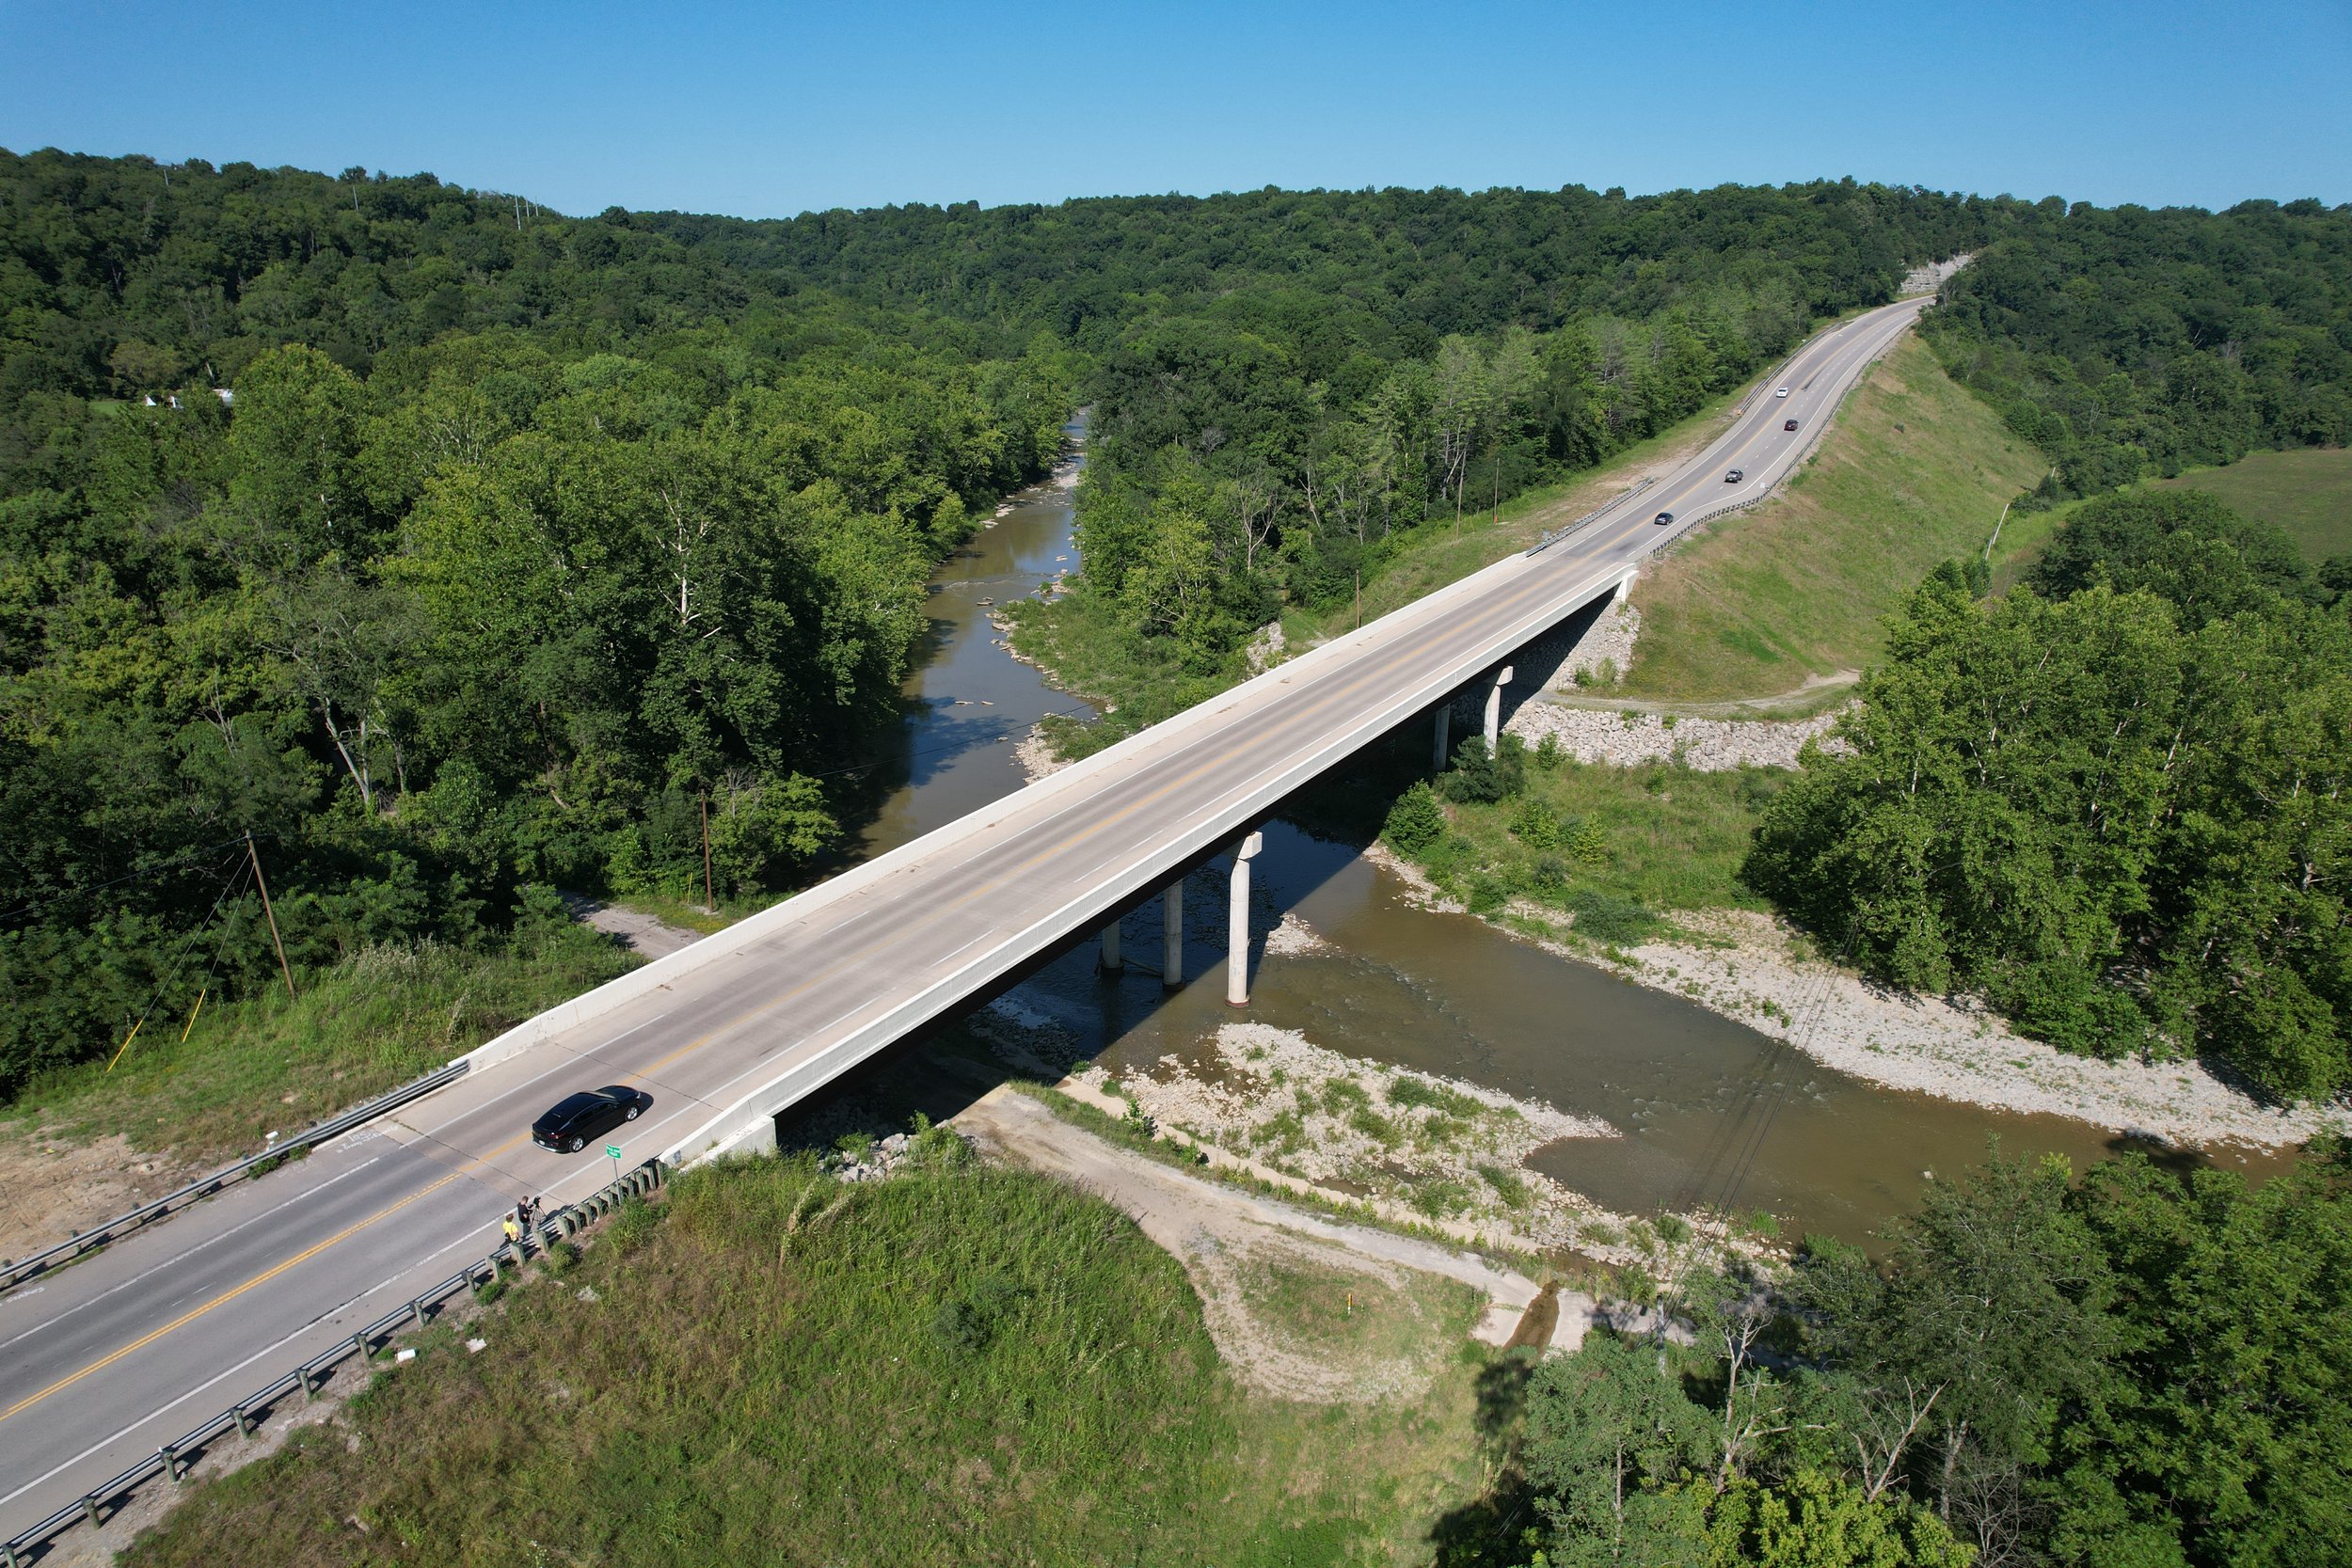
A Bird’s-Eye View: Hunter Evans captured this aerial view of the State Route 125 bridge over White Oak Creek near Georgetown, Ohio. Palmer Engineering designed the replacement bridge as part of a project that also included roadway improvements, rockfall protection, drainage improvements and more.